Benchmarking


As doctors, you are trained to collect patient vitals to detect or monitor medical conditions; but how many providers actually monitor the success of their practice? How many actually know the age of their account receivables or whether they are achieving their optimal collection percentage?
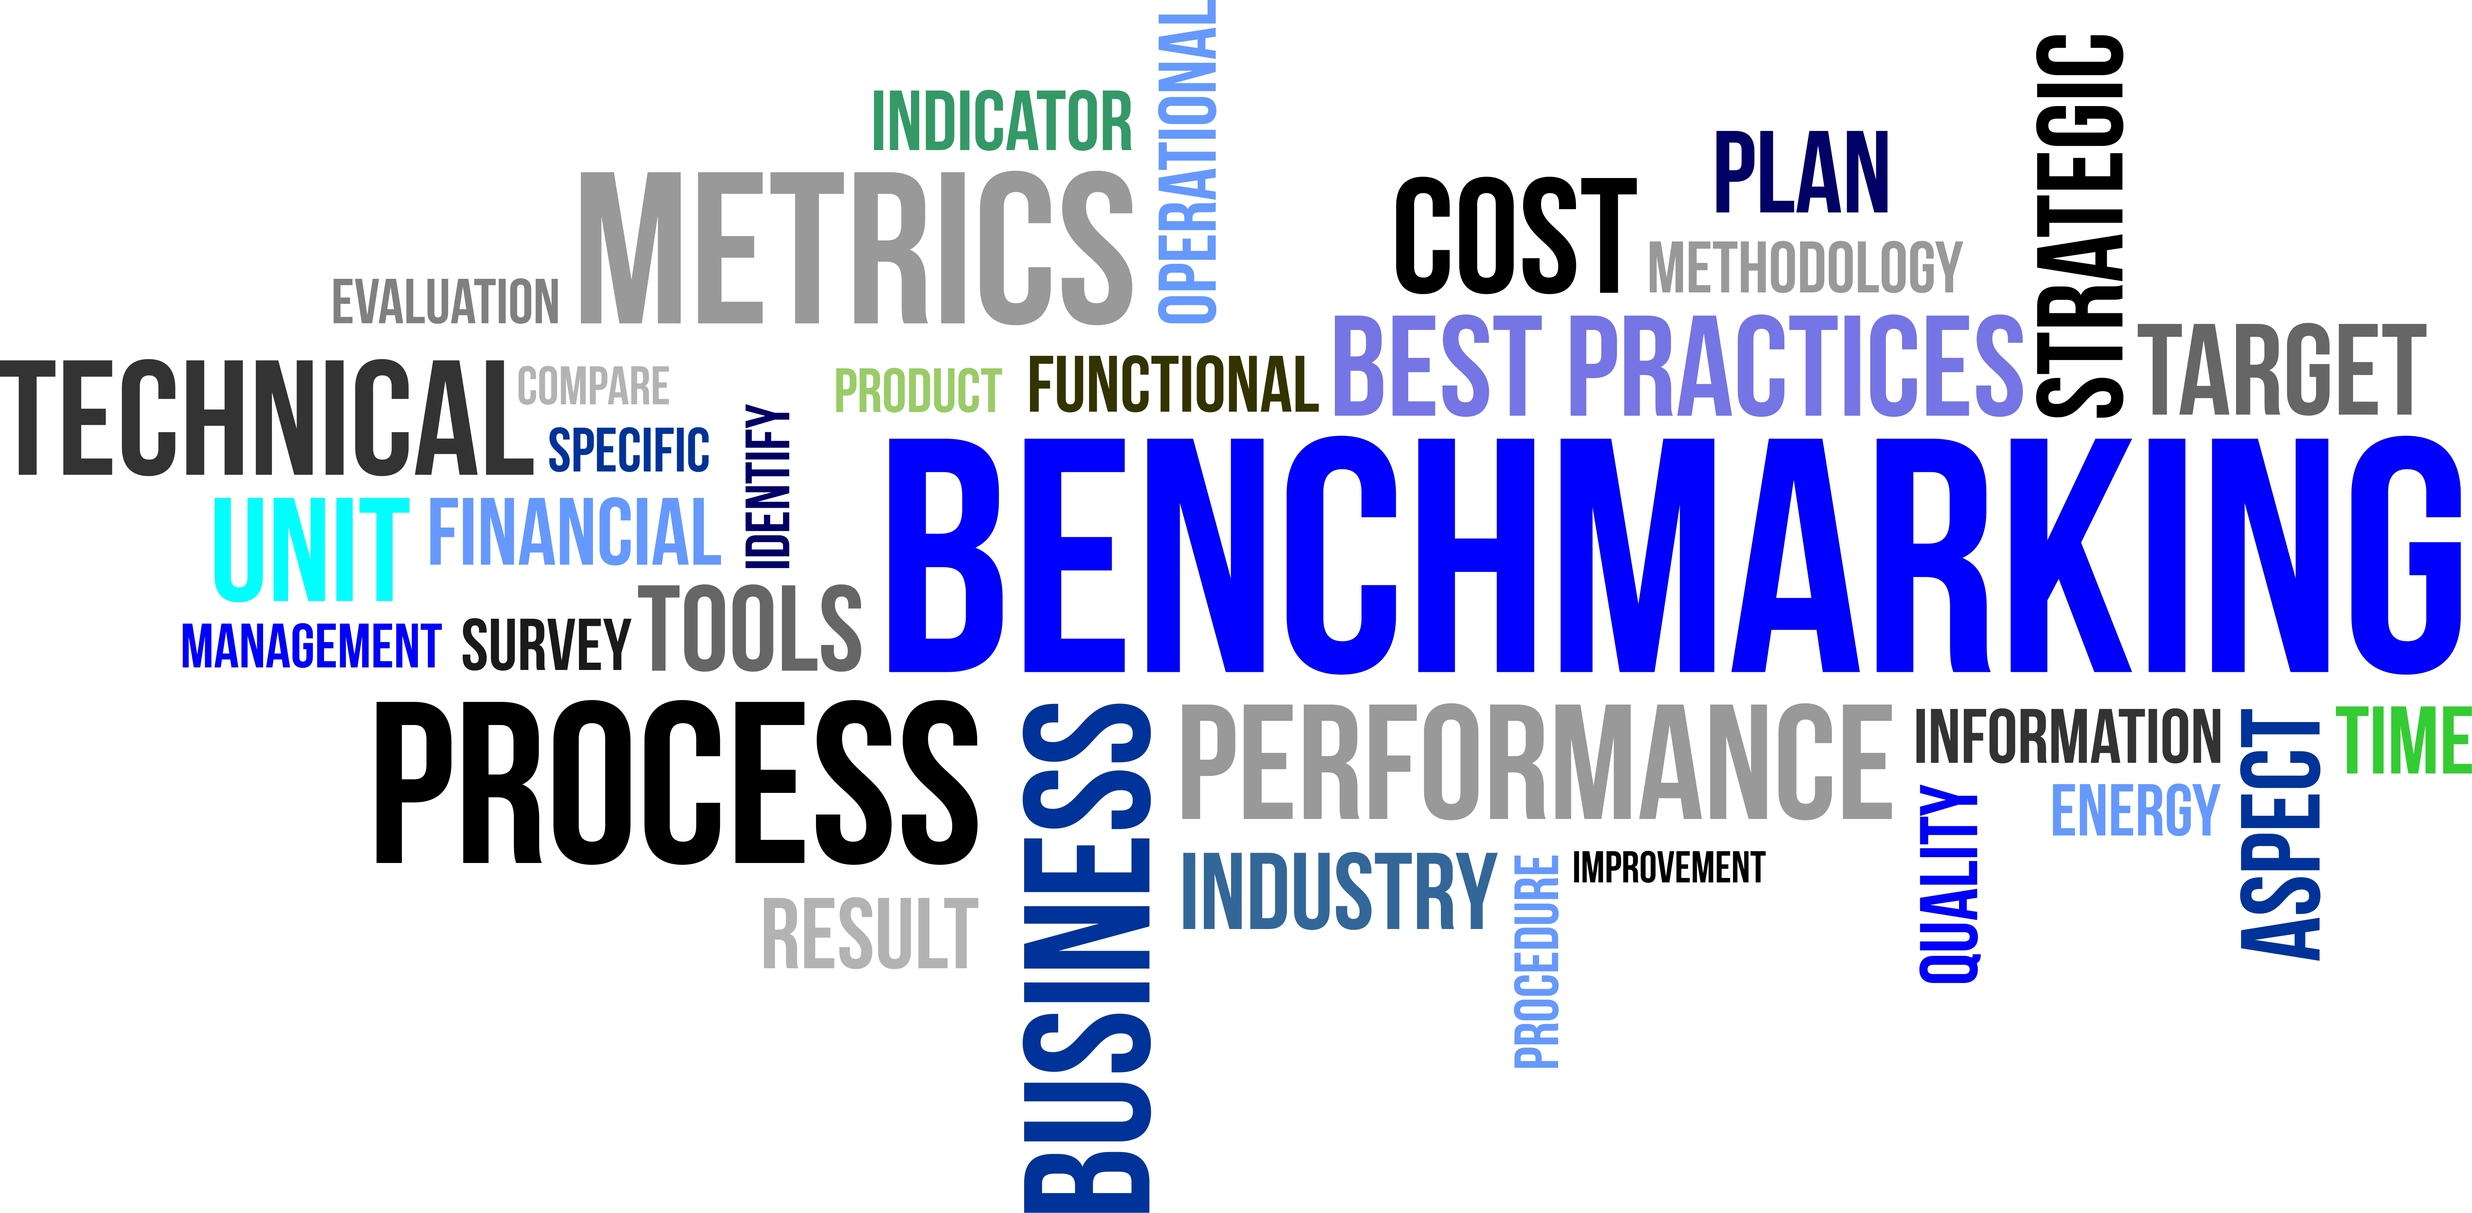
The effectiveness of any billing department or billing company can be determined by some simple monthly reports and benchmarking. Benchmarking is a process of defining AR standards against which your current collection performance can be measured. It is estimated that 20% of all practices meet the criteria that would define their performance as a successful practice in terms of Accounts Receivables.
The two basic benchmarks which will give you some insight as to how your practice is doing are: “Percentage of AR over 90 Days” and “Average Days in AR”.
What is “Percentage of AR over 90 days old?” This is a simple formula of adding all of your aging buckets over 90 days and dividing this number by your total AR. Although the calculation is simple, we have found that many practice managers do not run monthly aging reports and don’t know how old their AR is.
What is “Days in AR?” Days in AR is a calculation that indicates how long it takes a claim to get paid. The calculation is a simple formula of dividing your total AR by your average charges for 90 days. Sounds confusing but it is not.
Step 1. Add your total charges for the last three months and divide by 90 days. This gives you the average daily charges.
Step 2. Divide the average daily charges into your total AR. This is your practice’s “Days in AR.”
Benchmarks will vary depending on payer mix and specialty. Specialties with a high volume of office visits should have a ‘Days in AR’ lower than 30 days. Practices with a higher ratio of procedures to office visits can expect their claims to take longer. To get the averages for your specialty, you can reach out to your specialty association or MGMA. Below you can find general benchmarks, national averages and where AMPM clients’ fall on the grid.
AMPM beats national averages and industry benchmarks.
ABOUT US
Established 2002, Advanced Medical Practice Management is a New Jersey based, full service medical billing company providing...
OUR SERVICES
AMPM is a full service billing company. Prior to your start date, AMPM will review your workflow and develop procedures that ensure...
WHY OUTSOURCE?
Outsourcing your billing can reduce your overhead and increase your overall income. AMPM's dedicated staff can help improve your cash...
BENCHMARKING
As doctors, you are trained to collect patient vitals to detect or monitor medical conditions; but how many providers actually monitor the success...